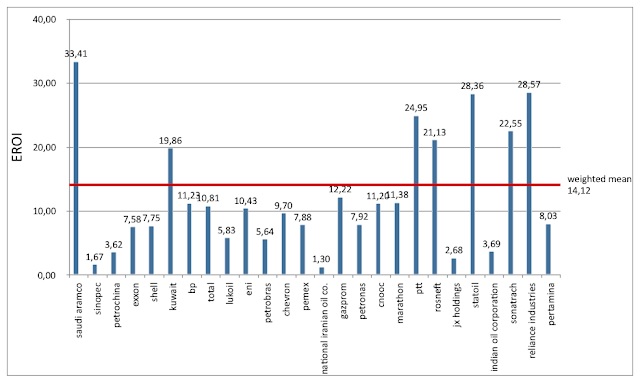
A simple but important study by Luciano Celi shows what is the real energy return that oil companies manage to attain. Much smaller than you would have believed, in several cases it is today well below 10. Which means that renewable energies already produce a larger EROI than oil and gas. No more excuses for not switching to renewables as fast as possible!And we have to do it fast because, as Celi shows, we are on the edge of the Net Energy Cliff of fossil fuels.
Researchers involved in the energy sector know very well what the EROI (acronym of Energy Return on Investment) is and how frequently is cited in scientific publications, in spite of differences of definition among researchers.
Well aware of the fact that I arrived last in the middle of a dispute that has engaged researchers for decades, I accepted the challenge and tried to understand, with Claudio Della Volpe, Luca Pardi, and Stefano Siboni, if there was a way to know something that is difficult know: the EROI of oil companies.
The method we have implemented is quite simple, even if with some useful simplification that we have discussed in details in our paper.
The denominator in the EROI value is the Energy Invested, while the numerator is the Energy Return (how much energy is gained with respect to the investment). Knowing the numerator it is quite simple (we are talking of oil companies) because this value corresponds to the production of a day (or of a year). The issue in different cases was knowing the value of energy cost of that production. It is difficult to know how much energy they use to produce what they produce in a year (or in a day), sitting at a desk without wandering the world knocking on the doors of companies. However… we have found an indirect way to have these data.
The oil companies are requested to compile a Sustainability Report (SR) yearly. Even if not mandatory many companies have accepted to prepare them probably under the pressure of the public opinion or/and the business branch named CSR (Corporate Social Responsibility), especially after the alarms launched at the last world conferences on climate.
In these reports, it is possible to find the emissions of their up- and downstream activities expressed in CO2 equivalent. This is good news because we can try to do a mental experiment: to burn all oil that a company produces and convert it in CO2 equivalent, with a simple stoichiometric ratio. In this way, we have the equivalent value in CO2 of production (numerator) and the equivalent value in CO2 of emissions (denominator).
As already mentioned this is an approximation – first we have many kinds of oil, moreover the petroleum production almost always includes a quota of natural gas that has a different composition (mostly methane) and a different HHV (Higher Heating Value) compared to oil – but we have corrected our estimation taking into account these variables. The interesting side of the issue is that the data are above criticism because they come directly from the oil companies reports (Sustainability, Annual, Commercial, and so on).
The choice of companies
I focused my research activity on SR 2015 and looked at the companies with the highest revenues in the world. I have found this list (on worldatlas.com or Wikipedia: both these sources – the second one takes the data from the previous one – are updated to 2017) and I have chosen to make a cut off for a market share above 1%. According to this criterium the companies selected are 30:
Company Billions $ Market share %
- Saudi Aramco 478,00 8,31 34,77
- Sinopec 455,50 7,92
- China National Petroleum Co. 428,62 7,45
- PetroChina 367,98 6,40
- Exxon Mobil 268,90 4,68
- Royal Dutch Shell 265,00 4,61
- Kuwait Petroleum Corporation 251,94 4,38
- BP 222,80 3,88
- Total SA 212,00 3,69
- Lukoil 144,17 2,51
- Eni 131,82 2,29
- Valero Energy 130,84 2,28
- Petrobras 130,00 2,26
- Chevron Corporation 129,90 2,26
- PDVSA 128,44 2,23
- Pemex 117,50 2,04
- National Iranian Oil 110,00 1,91
- Gazprom 106,30 1,85
- Petronas 100,74 1,75
- China National Offshore Oil 98,53 1,71
- Marathon Petroleum 97,81 1,70
- PTT 93,55 1,63
- Rosneft 91,72 1,60
- JX Holdings 90,67 1,58
- Engie 89,64 1,56
- Statoil 82,48 1,43
- Indian Oil Corporation 81,55 1,42
- Sonatrach 76,10 1,32
- Reliance Industries 73,10 1,27
- Pertamina 70,65 1,23 < 1% Others 623,27 10,84 Total amount >>>> 5.749,52 100,00
Highlighted in green is found the total amount of the market share for the first five companies: this value is quite high considering that the first thirty companies represent almost the 90% of the market share, and only the 16,6% of them hold the 34,7% of the market share.
The EROI values
Applying the method briefly described above, the estimated values of EROI are represented in the graph below:

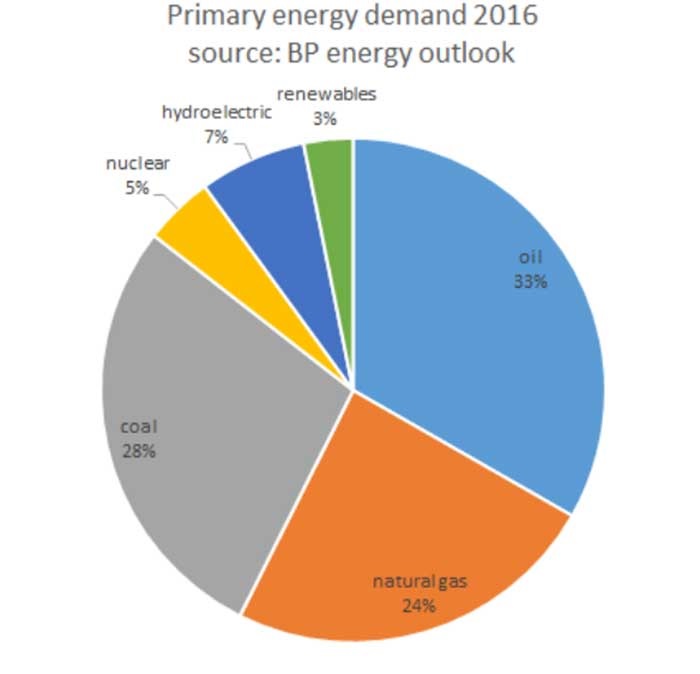
If we consider that the total contribution of oil and gas to the world primary energy demand in 2016 was 57.41% of the total (as shown in the graph below), the weighted mean of the EROI is rather low. Why does it seem that nothing happens?
The explanation is found in the relation between EROI and Net Energy.

The net energy and the Seneca Cliff
Net energy is defined as:
Net Energy (NE) = Energy Return – Energy Investment.
If we divide all terms for a single quantity ER, the result is:
NE/ER = 1-(1/EROI)
and, under the hypothesis of the ER always equal 100, the NE value can be expressed in percentage.
So, the equation is:
NE(%)= [1-(1/EROI)]*100.
If we graph NE vs. EROEI the result is the following:
The industrial society experiences Net Energy, not EROI, decline. As shown in the graph above, there is a strong non-linear relation between Net Energy and EROI. For a long range of EROI values, say from 100 to 10, the Net Energy is declining very slowly. Presently although the EROI decline is quite clear the Net Energy is still well above 90%. The society feels pretty safe. The problem is that we are walking along a cliff and it is increasingly urgent to make an energy transition, before finally ending up in the abyss.
 Eurasia Press & News
